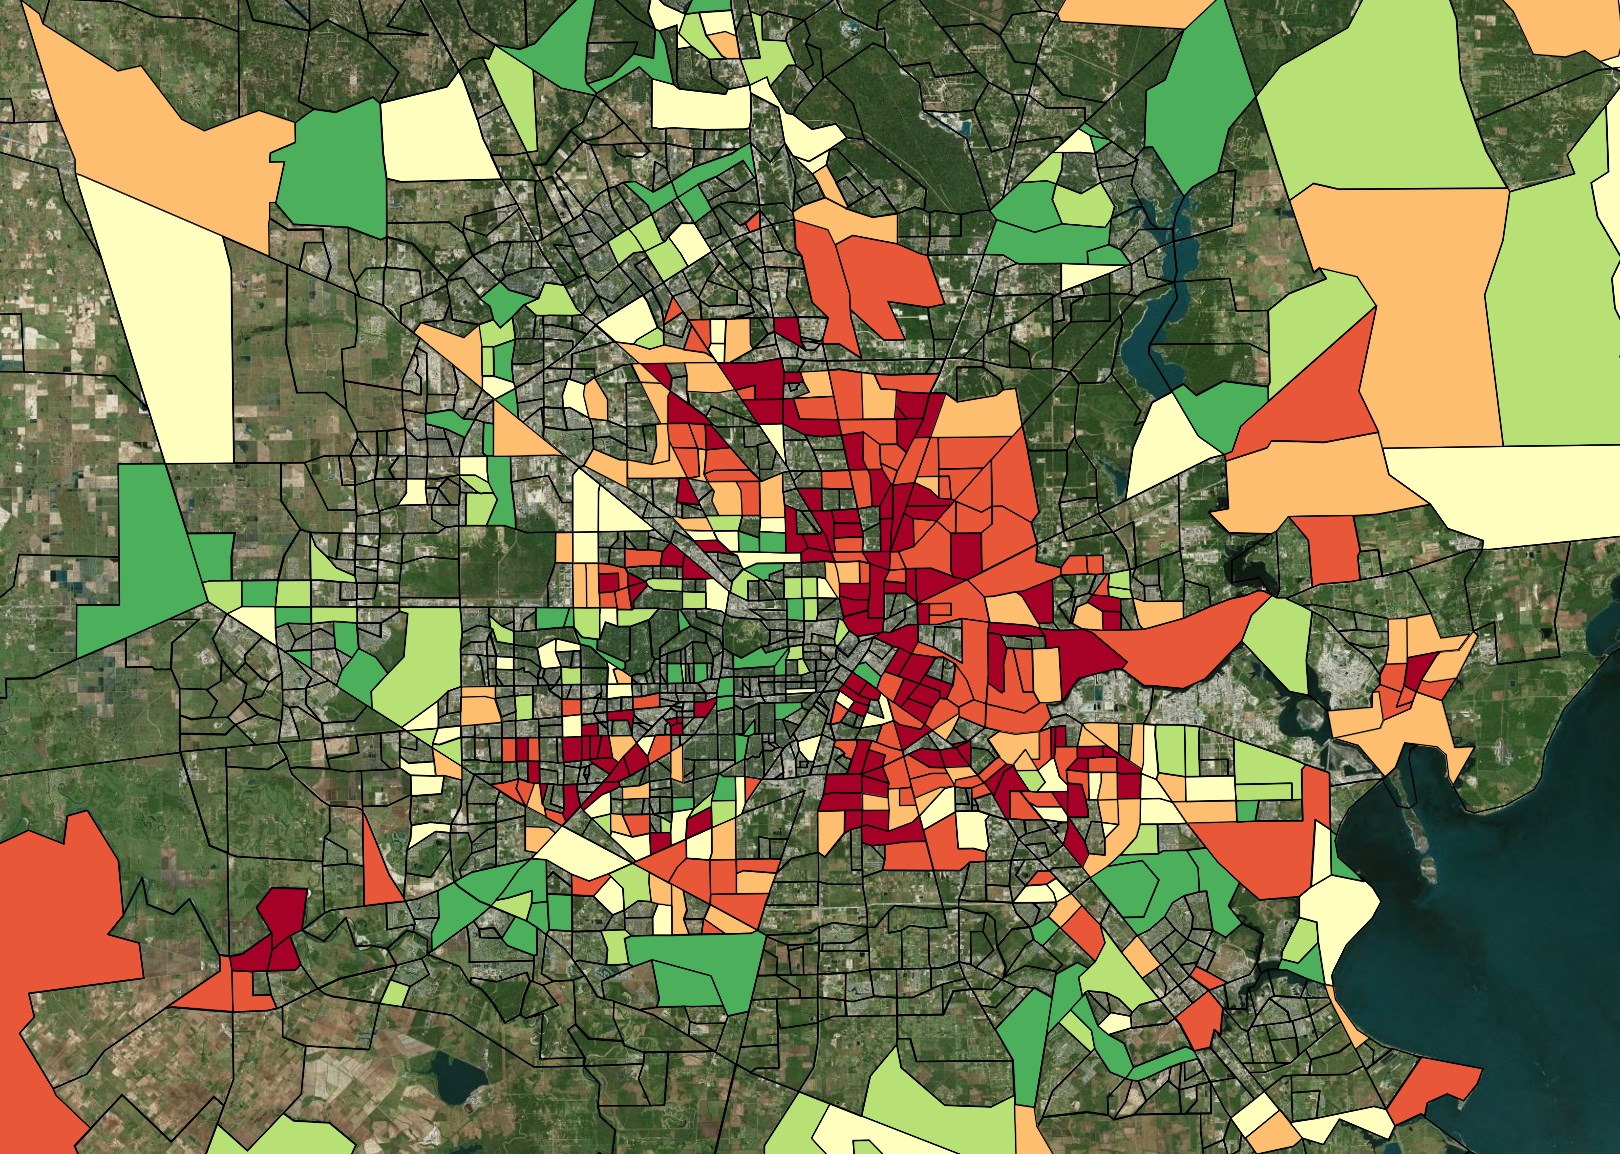
In today’s data-driven environment, the ability to visually interpret demographic and geographic information is crucial for decision-makers across various sectors. By linking OpenStreetMap (OSM) data with census tract information, we can create detailed visualizations that reveal patterns and insights into almost every type of demographic data. This blog post explores the benefits of combining these rich data sources and provides a step-by-step guide on how to do it using QGIS.
Using OSM Data with Census Data
Link Open Street Maps
Data to the individual
census tract

The Power of Combined Data
Bringing Geographic and Demographic Worlds Together
Integrating OSM data with census tracts enriches the geographic data with demographic layers, allowing for a multifaceted analysis of areas down to very local levels. This integration facilitates a range of applications from urban planning and market research to social sciences and emergency response planning. By combining these datasets, analysts can:
- Enhance Decision Making: Understand demographic distributions such as age, income, and population density in the context of geographic features like roads, buildings, and natural resources.
- Target Services and Resources: For governments and businesses, this means being able to tailor services and resources more effectively to meet the needs of specific communities.
- Improve Urban Planning: Planners can visualize how different demographic groups are distributed across cities, aiding in everything from the placement of new parks to transit routes.
- Boost Research Capabilities: Researchers gain a tool for conducting socio-economic analyses that can influence policy-making and academic studies.
Open Source Mapping:
Use QGIS to combine the data sets
Getting the Geographical Framework Set
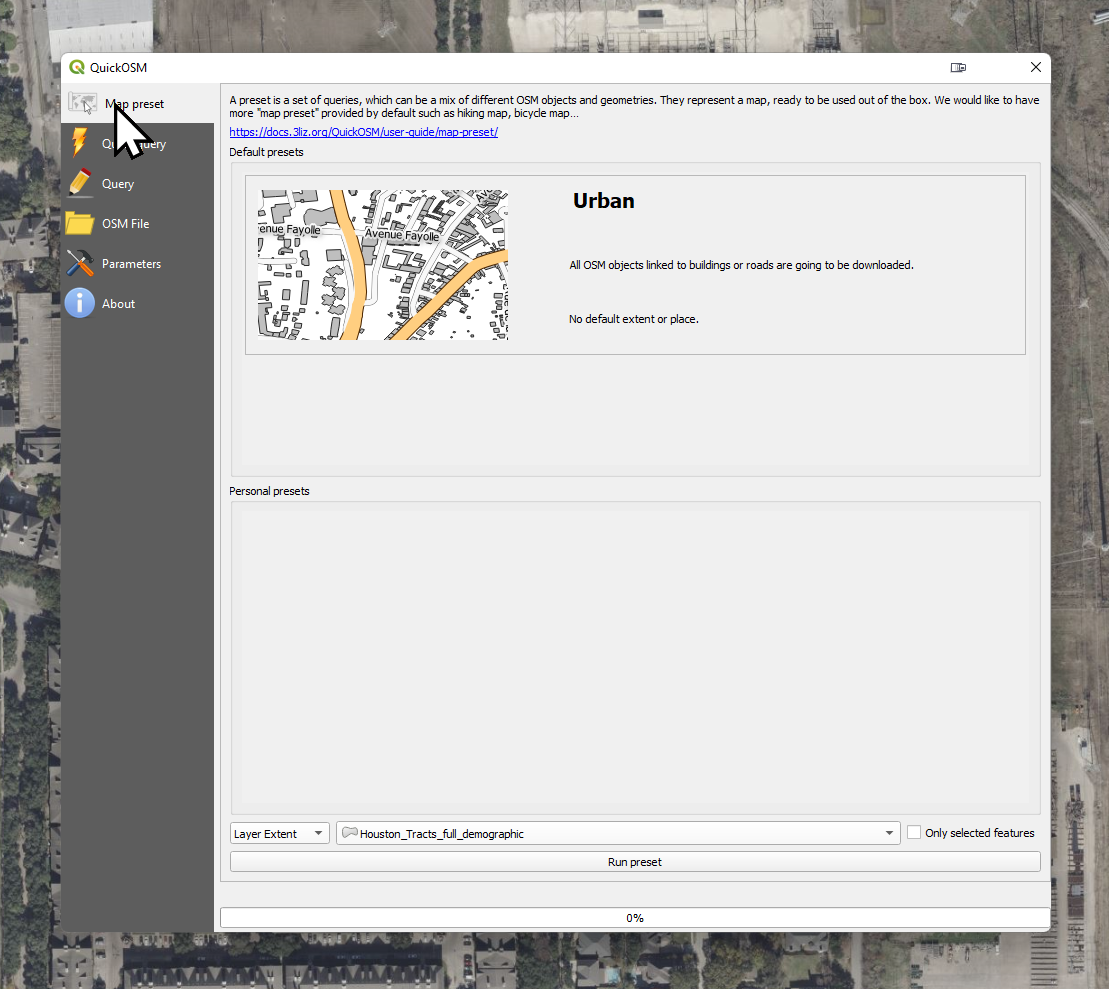
Importing OSM Data
Firstly, use the OSM importer in QGIS to import data for your area of interest. Although the pre-compiled OSM layers on our GitHub are useful, direct imports from OSM contain more detailed information due to fewer size limitations. This step ensures you have a comprehensive geographical base to which you can add demographic data.
Bridging Data with Unique Identifiers
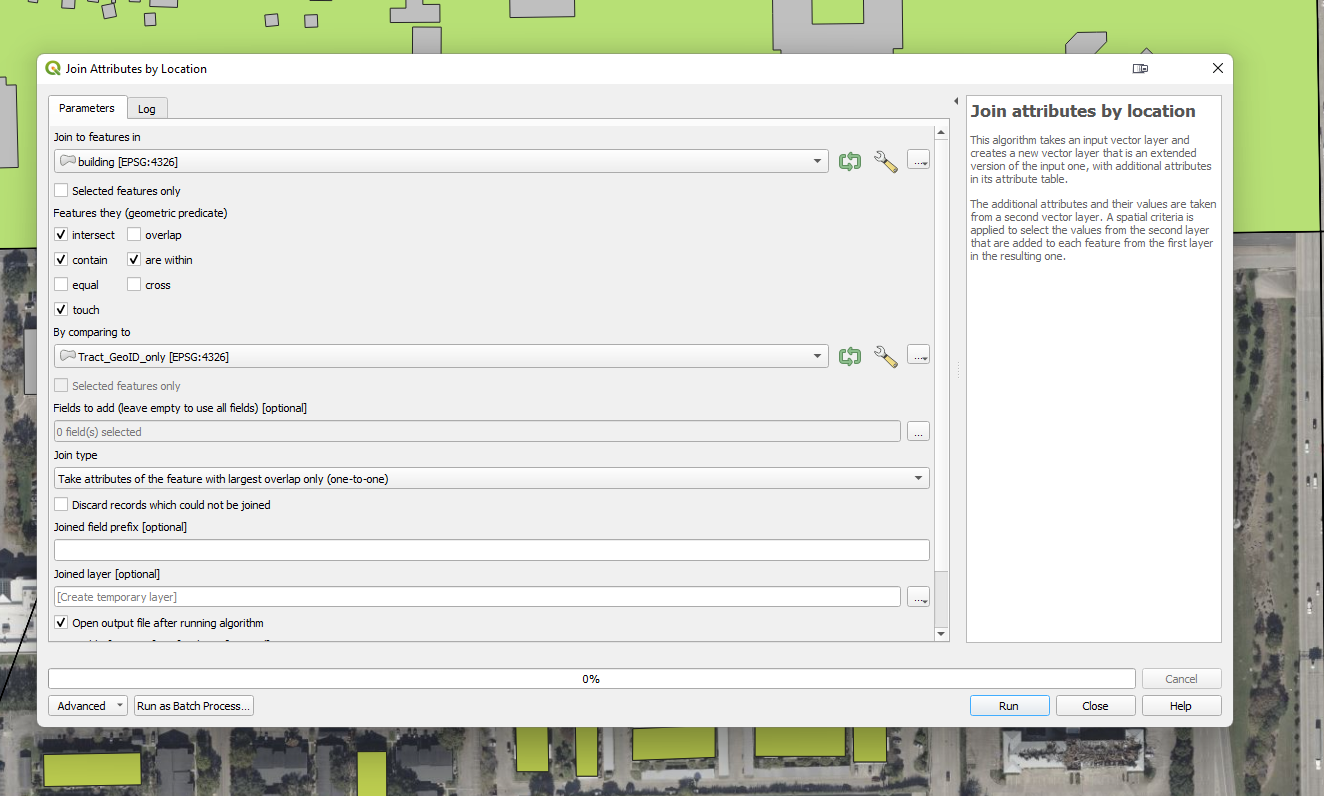
Adding GeoIDs
Once you have your OSM data in QGIS, the next step involves joining attributes by layer to add the GeoID to your dataset. The GeoID is crucial as it serves as the connecting identifier between the geographic data from OSM and the demographic data from the census. This attribute linkage is what makes visualizing demographic distributions possible.
Merging Maps and Demographics
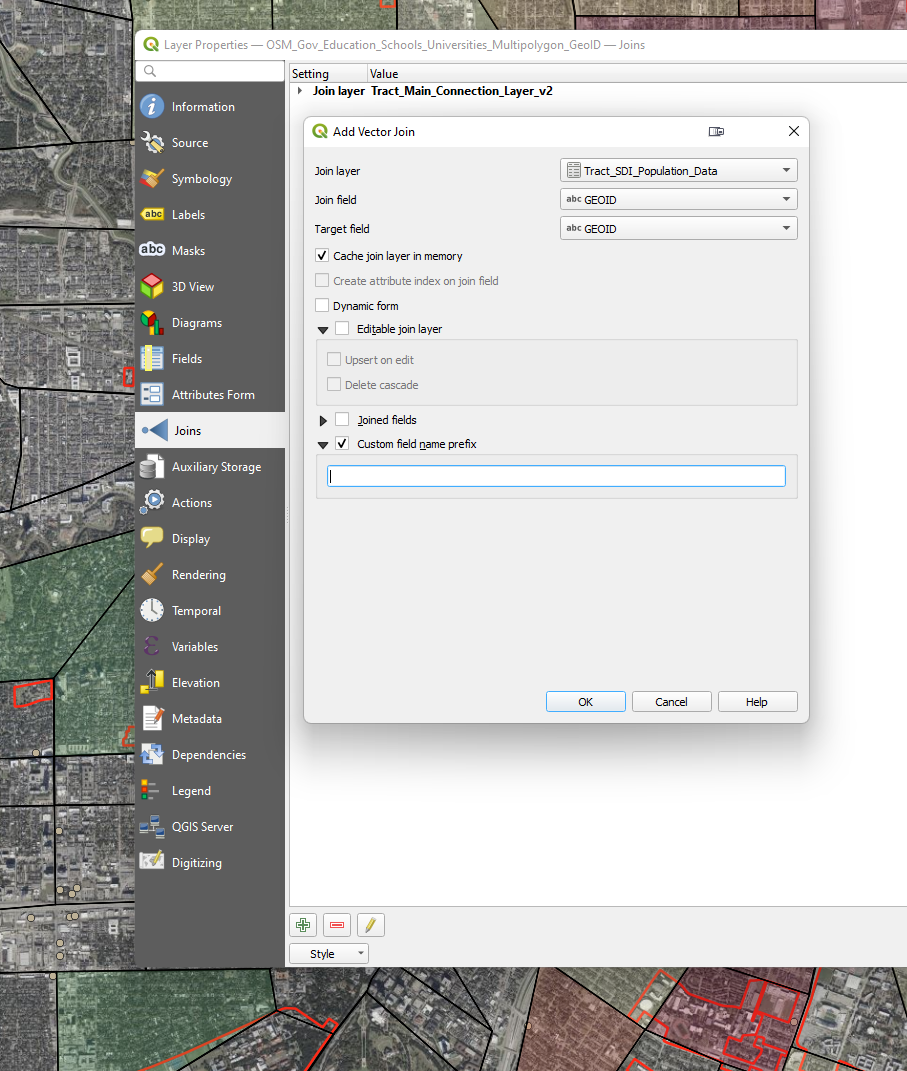
Joining Data Layers
With GeoIDs in place, proceed to join the data layers to your OSM layer using the GeoID as the key field. Most census tract datasets are organized around the GeoID, making it straightforward to align demographic data with the corresponding geographic locations on your map.
Seeing the Big Picture
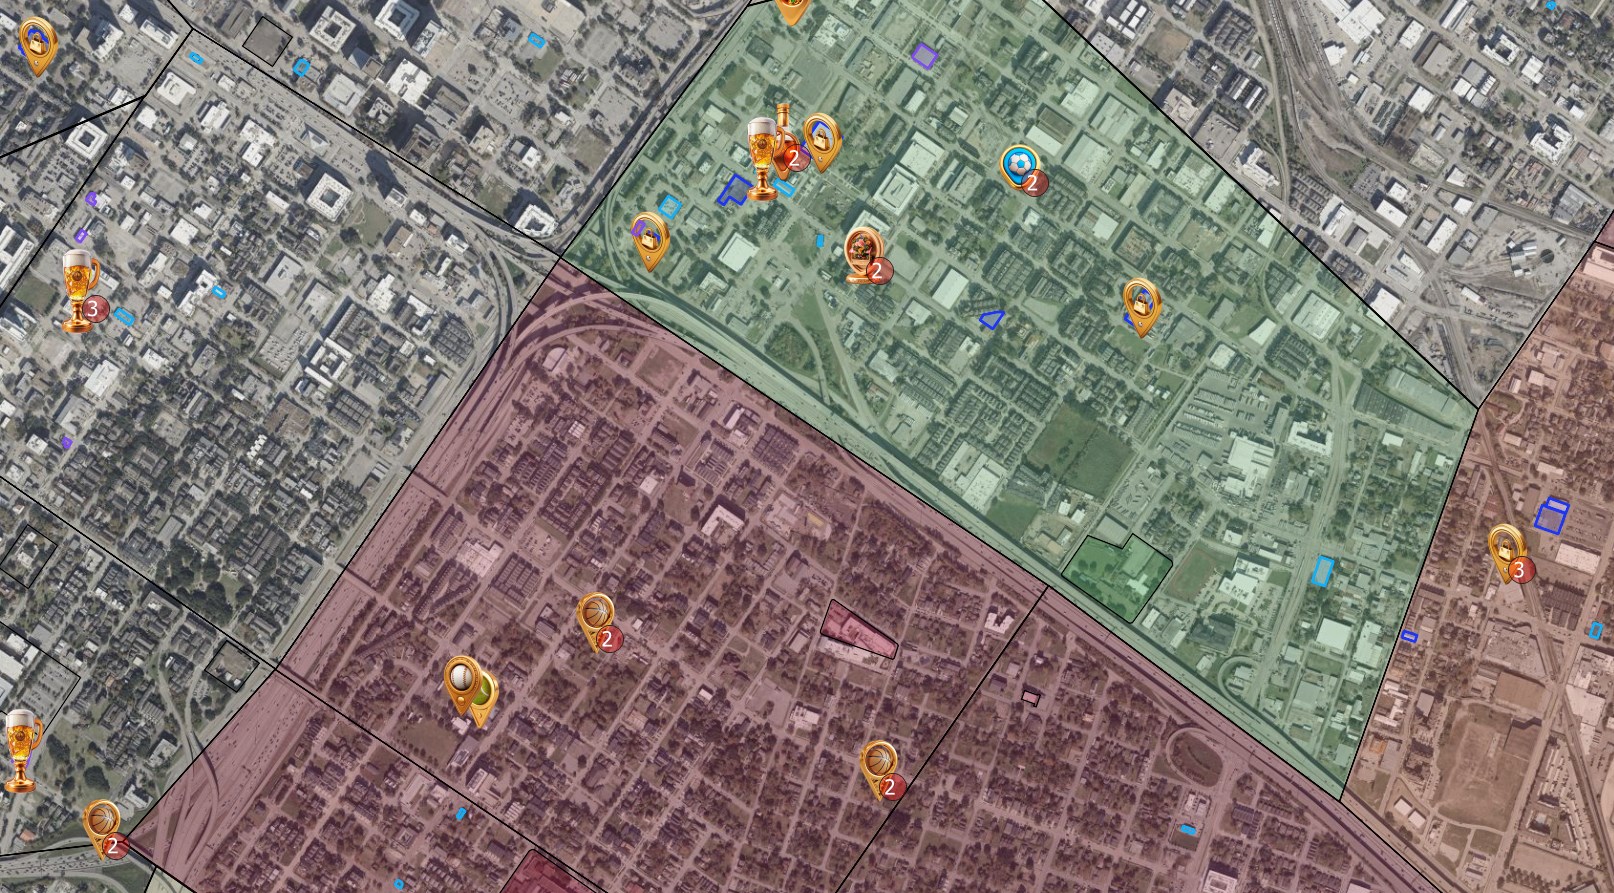
Visualizing the Data
Finally, visualize the combined data. QGIS allows for various visualization techniques, whether you prefer to use centroids with icons for a simplified view or multipolygons for a more detailed geographic outline. This step transforms your data into a visual story, making it easier to analyze and understand the demographic landscapes.
Create any visualization
Combine the data in any combination
Combining OSM data with census tracts in QGIS not only enhances the depth and breadth of geographic and demographic analyses but also transforms raw data into actionable insights. Whether you’re a policy maker, a business analyst, or a researcher, these visualizations serve as powerful tools for understanding and addressing community needs and changes. With these steps, you’re well-equipped to start integrating and visualizing your own data for informed decision-making and strategic planning.

